 AI
AIBird guides
How to Read a Bird Distribution Map
Colors, hexagons, and gray areas are not decoration: each answers a different question about where and when a bird has been documented.
Reviewed:Prepared with AI assistance and linked sources. Illustrations are not field photographs.
Two ways to draw a bird's presence
A bird distribution map is not a photograph of the land, but a representation of data. It can be built from real observations, from statistical models, or from expert opinion. Knowing which of those three origins applies to the map you are looking at completely changes what you can conclude.
This guide explains how to read the visual elements of modern analytical maps and breeding atlas maps, using two Puerto Rico birds as examples: the Osprey and the Puerto Rican Tody. The goal is not to memorize colors, but to ask the right questions before drawing conclusions.
Bird guides
Three key ideas
Color = temporadaColor indicates the season in which the species is estimated to be present.Purple: year-round. Red: breeding. Blue: non-breeding. Yellow: pre- and post-breeding.
Gris = dato ausenteDark gray does not mean the bird is absent, but that there is not enough data to predict.Light gray does indicate absence or very rare occurrence.
Hexágono = unidad de esfuerzoIn a breeding atlas, each hexagon summarizes the highest breeding evidence category recorded.It is not a single observation point or an individual nest.
01
What each color and each gray means
eBird's analytical maps use a seasonal color code. Purple marks places where the species is present year-round; red, the breeding season; blue, the non-breeding season; and yellow, the pre- and post-breeding seasons. Light gray indicates absence or very rare occurrence, while dark gray marks areas where predictions could not be made due to lack of data.
That distinction between the two grays is the most misinterpreted. A dark gray area does not prove the bird is not there: it says the model does not have enough information to make a statement. Confusing the two grays leads to false conclusions about distribution gaps that are actually sampling gaps.
02
Expert-opinion maps versus analytical maps
Before citizen-science projects like eBird, ornithologists created field-guide distribution maps from expert opinion. Those experts knew a lot about when and where each species occurred, but they could not be everywhere. The result was a coarse overview of the range.
Today's analytical maps are based on shared observations and statistical modeling techniques. eBird describes them as more accurate than traditional maps and capable of revealing fine-scale relationships with topography and detailed seasonal patterns. The practical consequence is that an old map and a new one can show the same species with different boundaries without the bird having changed its behavior.
03
The Puerto Rico case: hexagons and breeding evidence
The Puerto Rico Breeding Bird Atlas (PRBBA) collected and summarized information on the timing of breeding and geographic distribution of 130 breeding bird species in Puerto Rico and its associated islands and cays. Fieldwork was coordinated by the Puerto Rican Ornithological Society (SOPI) and involved 344 volunteer observers who contributed more than 45,500 individual bird observations from 2004 through 2009.
Following standard breeding bird atlas protocol, observers searched for breeding evidence in 479 hexagons, each 24 km², covering Puerto Rico and its satellite islands and cays. Each observed behavior was classified within a hierarchy from simply observed, with no evidence of breeding, to possible, probable, or confirmed breeding evidence. For each species, the highest category reached in each hexagon was plotted.
That means a colored hexagon in a breeding atlas does not equal a nest found. It equals the highest level of evidence recorded in that area during the study period. A hexagon with confirmed evidence and one with possible evidence may look similar on a low-resolution map, but they tell different stories.
04
Practical comparison: Osprey and Puerto Rican Tody
The Osprey (Pandion haliaetus) is a diurnal, fish-eating bird of prey that tolerates a wide variety of habitats, nesting in any location near a body of water providing an adequate food supply. Its occurrence in the Puerto Rico catalog is recorded as native, not endemic, and not as resident or breeder within the catalog's scope. Its movement is described as migratory, with long-distance dispersal and also sedentary or resident depending on the population.
The Puerto Rican Tody (Todus mexicanus) is endemic to Puerto Rico, resident and breeding, and neither migratory nor vagrant. Its habitat includes forests, woodland, karst, and coffee and shade plantations. The Forest Service describes it as common and widespread in Puerto Rico, from the coast to the mountains, in forested areas including damp forests of hills and mountains, shade coffee plantations, and dense thickets in the arid lowlands of the south coast.
When comparing their maps, the question changes. For the Osprey, a seasonal map helps you see in which season it is estimated present and in which it might be passing through. For the Puerto Rican Tody, a breeding map helps you see in which hexagons breeding evidence was documented. They are not the same question and they are not read the same way.
05
Exercise and checklist
Exercise: choose a species you are interested in and look for two different maps, one from a traditional field guide and one analytical if available. Before looking at the colors, write down these questions: what season does each color represent?, what does dark gray mean on this map?, what geographic unit does it use: hexagon, grid, point, or polygon?, what time period do the data cover?, does the map show presence, abundance, or breeding evidence?
Checklist for reading any distribution map: 1) Identify the source and year. 2) Find the legend and read what each color means. 3) Distinguish real absence from lack of data. 4) Identify the geographic unit and its size. 5) Ask whether the map shows presence, abundance, or breeding evidence. 6) Check for notes on limitations or sampling effort. 7) Compare with a second map if possible.
A useful activity is to take one hexagon from the breeding atlas and ask what evidence would be needed to move up a category: from observed to possible, from possible to probable, from probable to confirmed. That trains you to read the map for what it is: a summary of effort and evidence, not a photograph of the land.
Linked profiles
The two birds in this example
A migratory coastal bird versus a resident forest endemic: two different ways of appearing on a map.
AI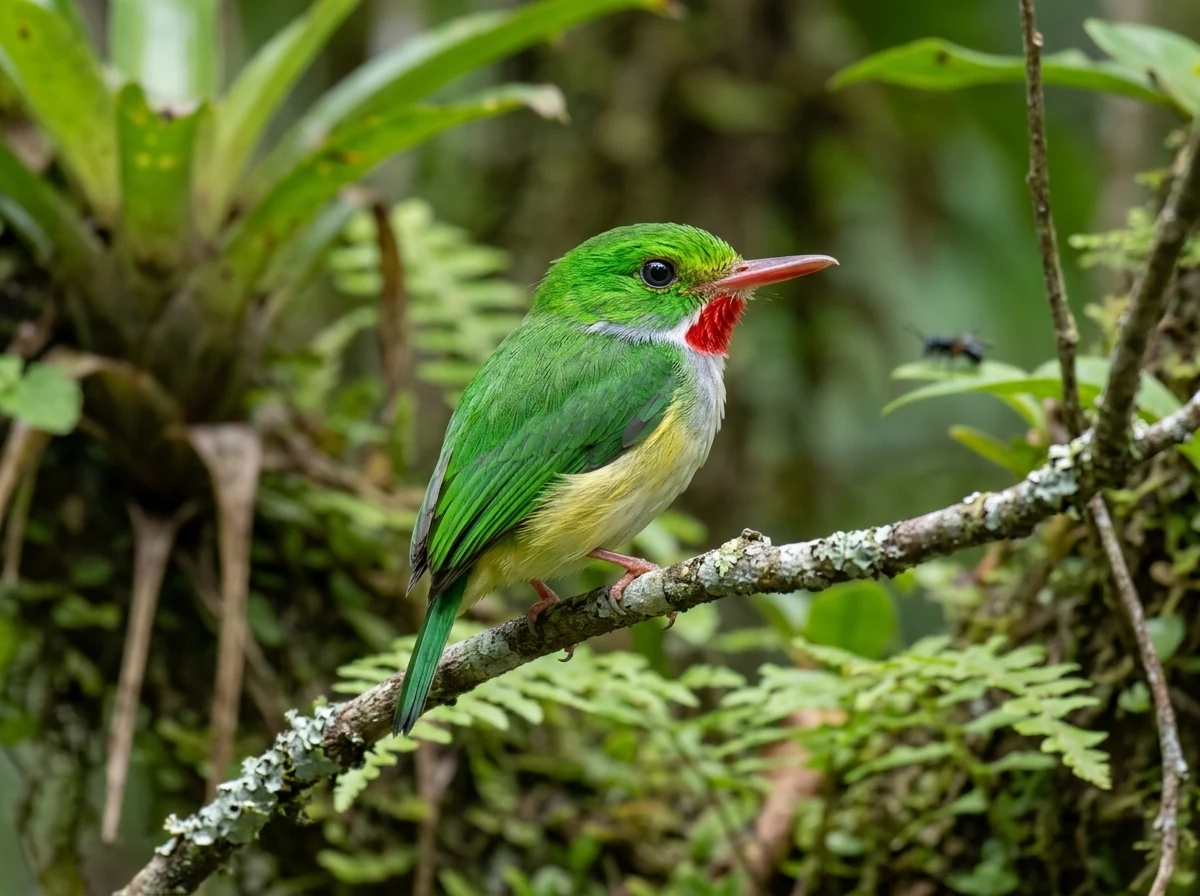 AI
AI01
What does dark gray mean on a distribution map?
On eBird's analytical maps, dark gray indicates areas where predictions could not be made due to a lack of data. It does not mean the bird is absent. Light gray does indicate absence or very rare occurrence.
02
What is the difference between a distribution map and a breeding atlas?
A seasonal distribution map shows in which season a species is estimated to be present. A breeding atlas shows breeding evidence per geographic unit. The PRBBA used 479 hexagons of 24 km² and classified evidence as observed, possible, probable, or confirmed.
03
Why do an old map and a new map show different boundaries for the same species?
Because traditional maps were based on expert opinion, while analytical maps are based on shared observations and statistical modeling. eBird describes the analytical ones as more accurate and capable of showing detailed seasonal patterns.
04
Does a colored hexagon in a breeding atlas mean there is a nest there?
Not necessarily. Each hexagon summarizes the highest breeding evidence category recorded, which can be simply observed, possible, probable, or confirmed. A hexagon with confirmed evidence and one with possible evidence may look similar on a low-resolution map.
05
How do I know if a map shows presence, abundance, or breeding evidence?
By reading the legend and the source. eBird's seasonal maps show estimated presence by season. Breeding atlases show breeding evidence. If the legend does not clarify it, look for the source's methodological documentation before drawing conclusions.
Keep exploring
Connected routes
Sources and review
The evidence is one link away.
These sources support the editorial scope of this guide. Bird profiles also retain their own taxonomy, occurrence, and conservation references.
Reviewed:
01↗02↗03↗
eBird (Cornell Lab of Ornithology)
Range maps
Evidence for cited sections; consult the original document.USDA Forest Service, International Institute of Tropical Forestry
The Puerto Rico Breeding Bird Atlas (Gen. Tech. Rep. IITF-53)
Evidence for cited sections; consult the original document.USDA Forest Service, El Yunque National Forest
El Yunque National Forest | Puerto Rican Tody
Evidence for cited sections; consult the original document.The atlas continues