 AI
AISounds
How to read a spectrogram for Puerto Rico birds
Learn to turn sounds into images: axes, shapes, harmonics, and modulation for studying songs and calls.
Reviewed:
Prepared with AI assistance and linked sources. Illustrations are not field photographs.
Sound as an image
A spectrogram is a visual representation of the intensity of sound frequencies across time. Instead of relying only on your ears, you can see a bird's acoustic signature: its duration, pitch, and shape. This is useful in Puerto Rico, where many species are heard before they are seen.
Reading a spectrogram is like reading sheet music: time runs from left to right and frequency is represented from bottom to top. High-pitched sounds appear near the top and low-pitched sounds farther down. The horizontal width of each mark indicates how long a sound lasts, and its shape reveals qualities such as whistles or nasal notes. With practice, you can compare recordings and sharpen visual identification of songs and calls.
Sounds
Three keys to reading spectrograms
Tiempo y frecuenciaBasic axesThe horizontal axis is time; the vertical axis is frequency. High-pitched sounds go up.
Líneas apiladasNasal soundAccording to the Audubon article, a nasal sound produces several stacked horizontal lines.
ModulaciónChanging shapeRises, falls, and vibrations appear as curves, steps, or vibrato.
01
The axes and visual elements
Every spectrogram has two main axes. The horizontal axis represents time: the recording moves from left to right. The vertical axis represents frequency, that is, how high or low a sound is; higher values are at the top. Intensity or loudness is shown by brightness or color: darker or more intense marks indicate louder sounds. In the Macaulay Library, for example, spectrograms now show frequencies up to 12 kHz, because although most bird sounds occur below 10 kHz, many go above that limit and are useful to see.
Basic shapes help you classify what you hear. A whistle appears as a single, nearly horizontal line. According to the Audubon article, a nasal sound produces several stacked horizontal lines. A trill looks like a rapid series of short, repeated marks. A tone that rises and falls is drawn as a curve. These categories do not replace listening, but they give you a visual vocabulary for comparing species and recordings.
02
Modulation: how pitch changes
Modulation is the change in frequency over time: a note can rise, fall, vibrate, or stay steady. On a spectrogram, modulation appears as the slope or shape of each mark. A flat line indicates a steady tone; a line that tilts upward indicates a rising tone; a wavy line indicates vibrato or a trill.
This element lets you distinguish sounds that otherwise seem similar. By observing modulation, you move from asking "what bird is it?" to precisely describing "how the pitch moves over time." That description is what you can compare across recordings and across species.
03
Tools to view spectrograms
You do not need specialized equipment to start. Several phone apps let you view spectrograms in real time and freeze or save sections. An Audubon article mentions SpectralPro Analyzer (Android) and SpectrumView (iPhone) as practical options; according to that 2017 article, SpectralPro Analyzer is a paid app ($4.49) and SpectrumView is free with paid extra features. The article's author recommends setting the sample rate to 22,000 Hz and using a black-on-white color scheme for graphing bird sounds. These recommendations are from 2017 and app availability or prices may have changed, so verify before installing.
For existing recordings, the Macaulay Library at the Cornell Lab of Ornithology displays spectrograms alongside its recordings. Its archive hosts nearly 2.4 million sound recordings, and updated spectrograms allow zooming, viewing long recordings without a length cutoff, and better visualization of background sounds. You can also use Merlin Sound ID, which converts audio into a spectrogram and analyzes it with a machine-learning model; however, the cited figure of 458 species is from 2021 and covers the U.S. and Canada. We did not find verification of local coverage in the consulted sources, so confirm current coverage in the app before relying on it for local identification.
04
A practical exercise with Puerto Rico birds
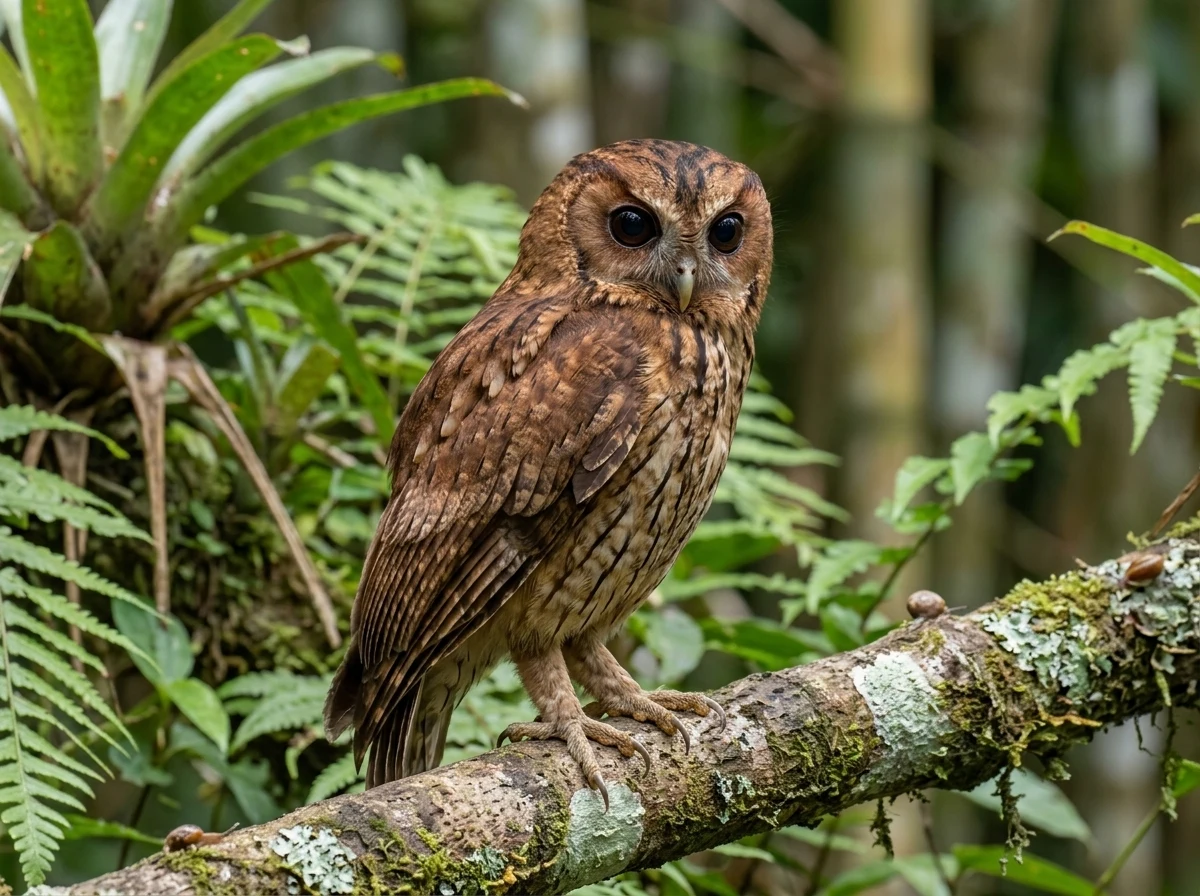
Choose a recording of a common species and watch its spectrogram while you listen. The Puerto Rican Owl (Gymnasio nudipes) is a good starting point: its song is described as a short, deep trill lasting 3–5 seconds, and the female sings at a higher pitch. As an illustrative expectation, not a documented fact, you might expect to see a broad, vibrant band at low frequencies, but the consulted sources do not include a labeled spectrogram or frequency measurements for this species. For the other species in this guide, the consulted sources do not include labeled spectrograms or frequency measurements; treat them as practice candidates, not documented examples.
For each recording, note three things: approximate frequency (high, medium, or low), duration of each note (short or long), and shape (flat, rising, falling, vibrating, or ladder-like). Then compare with another recording of the same species to see what is constant and what varies. This exercise trains your eye and ear at the same time.
Linked profiles
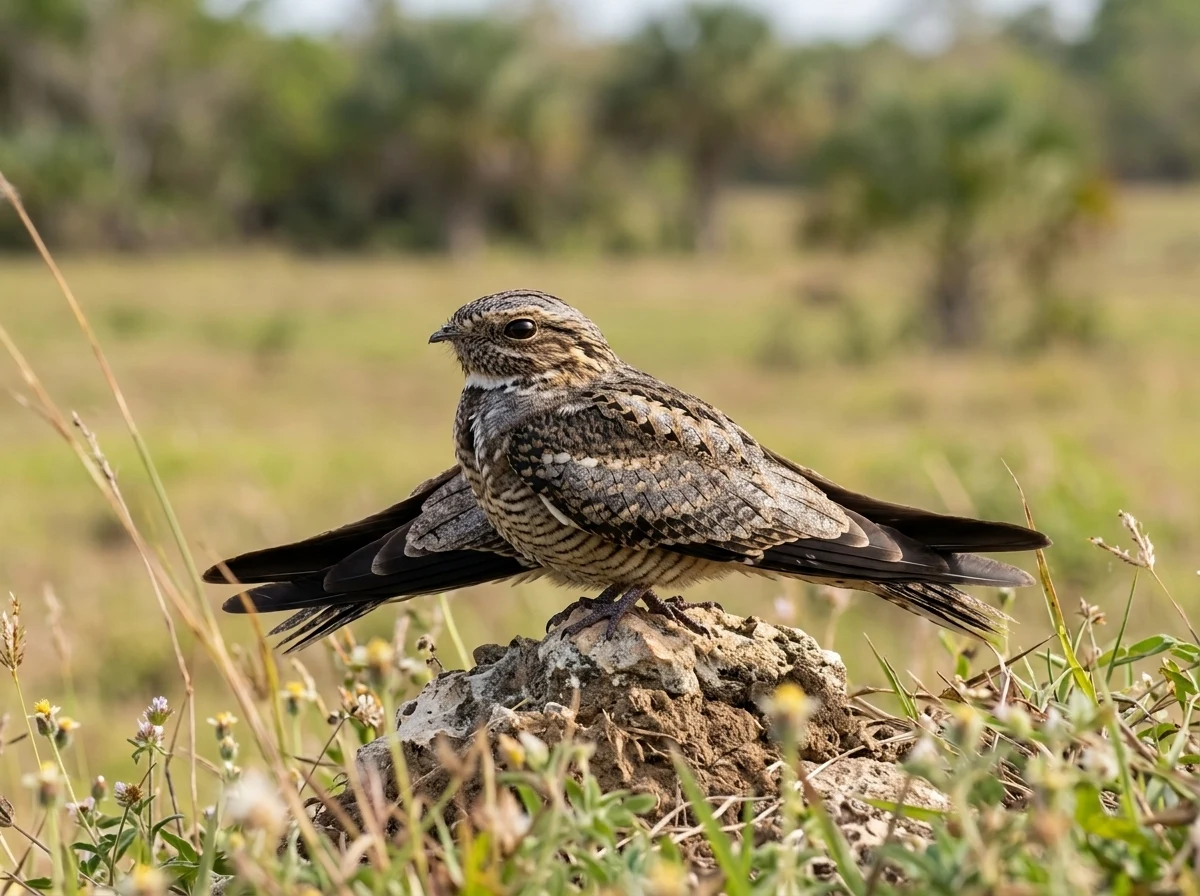
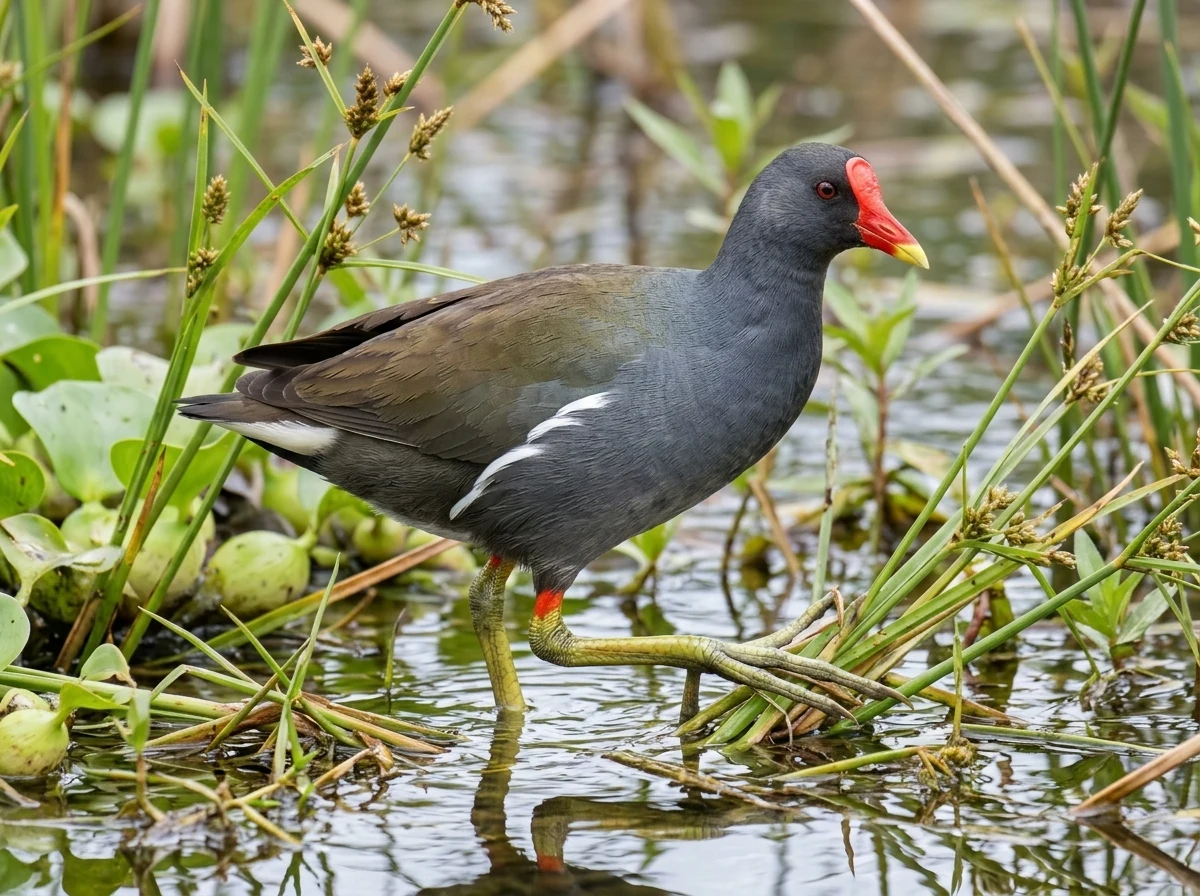
Birds mentioned in this guide
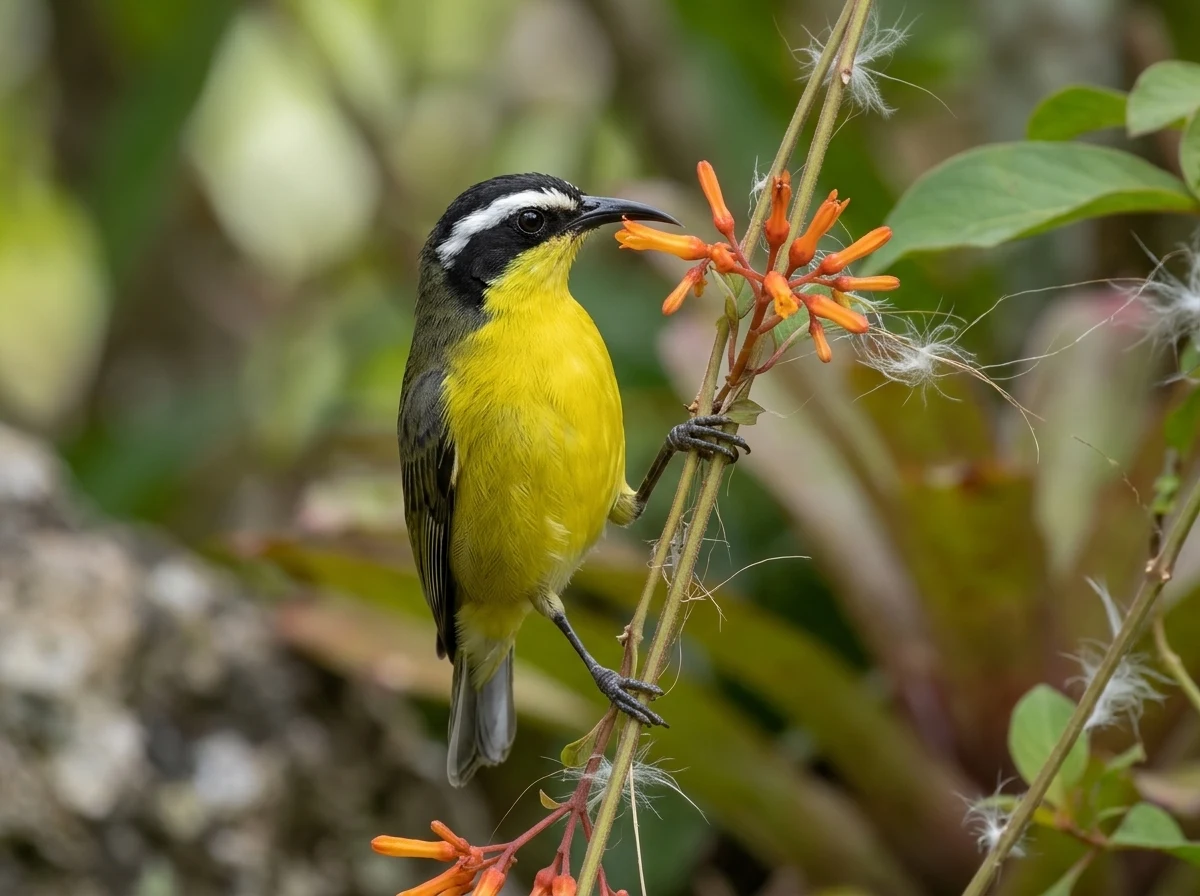
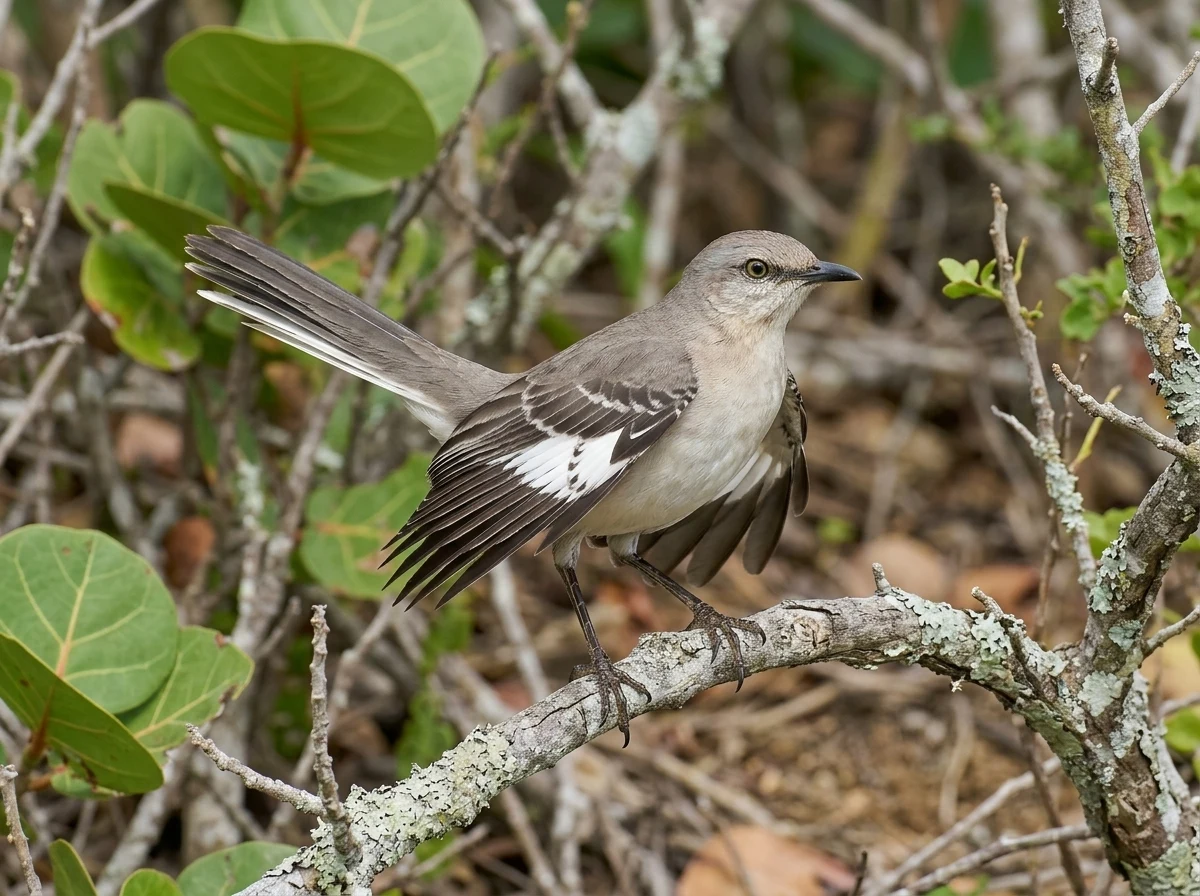
Puerto Rico species whose sounds you can practice on a spectrogram.
01
What do the colors on a spectrogram mean?
Colors or brightness represent sound intensity. Darker or more intense marks indicate louder sounds, while lighter ones indicate softer sounds. The Audubon article's author recommends a black-on-white scheme for graphing bird sounds.
02
Can I use my phone's microphone to make spectrograms?
Yes, but quality depends on how loud and close the bird is. The Audubon article notes that the bird must be loud and close for a clean visualization, and that adding an external microphone improves clip quality.
03
What is a harmonic and how do I recognize it?
A harmonic is a copy of a sound at a multiple of its fundamental frequency; this is a general acoustic notion, not a statement from the Audubon article. What the Audubon article does say is that a nasal sound produces several stacked horizontal lines on a spectrogram.
04
Does Merlin Sound ID work for Puerto Rico birds?
We did not find verification of local coverage for Puerto Rico in the consulted sources. The only available figure (458 species) is from 2021 and covers the U.S. and Canada. Verify current coverage in the app before relying on it for local identification.
05
Where can I find spectrograms of birds?
The Macaulay Library at the Cornell Lab of Ornithology hosts nearly 2.4 million sound recordings and displays spectrograms alongside its recordings. You can explore its archive to see the visual representation of songs and calls.
Keep exploring
Connected routes
Sources and review
The evidence is one link away.
These sources support the editorial scope of this guide. Bird profiles also retain their own taxonomy, occurrence, and conservation references.
Reviewed:
01↗02↗03↗04↗
Audubon (National Audubon Society), by Nathan Pieplow
Start Using Spectrograms to 'Read' Bird Songs and Calls
Evidence for cited sections; consult the original document.eBird / Macaulay Library, Cornell Lab of Ornithology
Macaulay Library Unveils New Look for Spectrograms
Evidence for cited sections; consult the original document.Macaulay Library, Cornell Lab of Ornithology
Behind the Scenes of Sound ID in Merlin
Evidence for cited sections; consult the original document.Birds of the World, Cornell Lab of Ornithology (author: Chloe Goodson)
Sounds and Vocal Behavior - Puerto Rican Owl (Gymnasio nudipes)
Evidence for cited sections; consult the original document.The atlas continues