 AI
AIFieldcraft
How to compare two bird sounds side by side
Listen, look, and listen again: an A/B procedure for separating similar sounds.
Reviewed: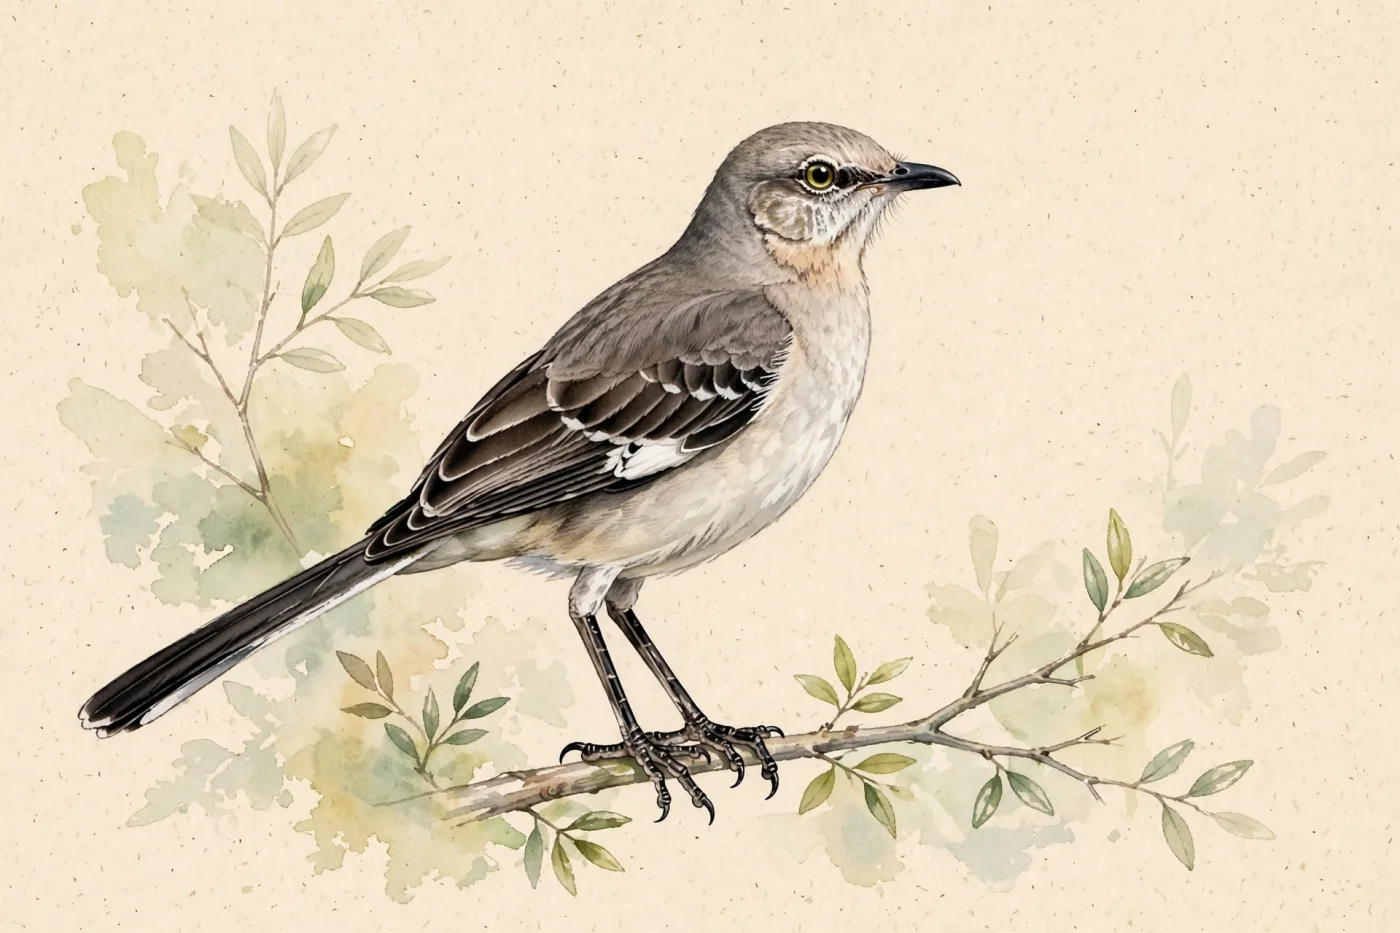
Prepared with AI assistance and linked sources. Illustrations are not field photographs.
Why compare instead of just listening
When two birds sound alike, the human ear loses details: a very fast pitch change, a brief pause, or a repeated note can slip by unnoticed. The solution is not to listen harder, but to compare in an orderly way. Spectrograms, which are visual representations of sound frequency intensity over time, allow us to compare recordings by sight, which can be more efficient and precise than by sound alone (s1).
This A/B method combines three simple tools: two selected recordings, a spectrogram view for each, and playback at reduced speed. It does not require professional equipment. The goal is to identify concrete differences — shape, rhythm, duration, pitch — and then return to the field with a clear expectation. Puerto Rico has species well suited to this practice, such as the Puerto Rican Owl, Common Gallinule, Clapper Rail, Northern Mockingbird, and Gray Kingbird.
Fieldcraft
Three key ideas
A/BDirect comparisonTwo recordings, two spectrograms, one decision.
LentoSlowed playbackSlowing down reveals notes the ear groups together.
FormaShape leadsThe shape on the spectrogram is each sound's signature.
01
Tools for side-by-side comparison
The central tool is the spectrogram. The Macaulay Library hosts nearly 2.4 million sound recordings and uses spectrograms to navigate that archive; its updated spectrograms show frequencies up to 12 kHz, offer better resolution for background sounds, and allow zooming in or out (s1). To compare two sounds, open two recordings in separate windows or tabs and place their spectrograms side by side. That way you can see the full shape of each sound while you listen.
In the field, spectrogram apps on a phone let you generate your own images. Nathan Pieplow recommends SpectralPro Analyzer on Android and SpectrumView on iPhone, with a sample rate of 22,000 Hz and a black-on-white color scheme for graphing bird sounds (s2). The main drawback is that the bird must be loud and close for a clean visualization; an external microphone improves quality (s2). For practice at home, archived recordings and a screen are enough.
02
How to read a spectrogram without being an expert
Reading a spectrogram is like reading sheet music: sound runs left to right, high-pitched notes near the top and low-pitched notes farther below (s2). The horizontal width of each note shows how long it lasts, and the shape indicates quality. A whistle looks like a single, nearly horizontal line; a nasal sound produces a bunch of horizontal lines stacked on top of one another (s2).
Terms help describe what you see. Elements are single sounds; phrases are collections of elements that repeat as a group; sections are groups of similar elements and phrases that may be marked by a change in pitch, speed, or phrase type (s3). When comparing two birds, don't look for a total difference: look for a repeatable difference. For example, American Robin phrases have very fast pitch changes that give a wobbly quality, while Rose-breasted Grosbeak phrases have slower, smoother, more evenly slurred changes (s3).
03
Slowed playback: what to listen for when you slow it down
Slowing down does not change the identity of the sound, but it separates what the ear groups together. A spectrogram can reveal little subtleties you may not have noticed; for example, a tiny break in the middle of a note can make it sound slightly double-syllabled, and once you see the break you start hearing it (s2). Slowed playback does the same: it turns an ornament into a sequence of elements you can count.
The procedure is simple. First listen to the recording at normal speed and note a general impression. Then reduce the speed and listen again, counting elements and pauses. Then return to normal speed and check whether the difference you noticed is still audible. If it disappears when sped up, it is probably not a useful field character. If it persists, it is a solid clue.
04
Puerto Rico species to practice with
The Puerto Rican Owl is a good starting point. It is an endemic Puerto Rico owl, without ear tufts, with two color morphs, and it is most easily located by its voice: a short, deep trill that lasts 3–5 seconds and is higher pitched in the female (s5). You can use that trill as a reference and compare it with another nocturnal bird recording you have available; observe on the spectrogram whether the energy stays steady or changes pitch.
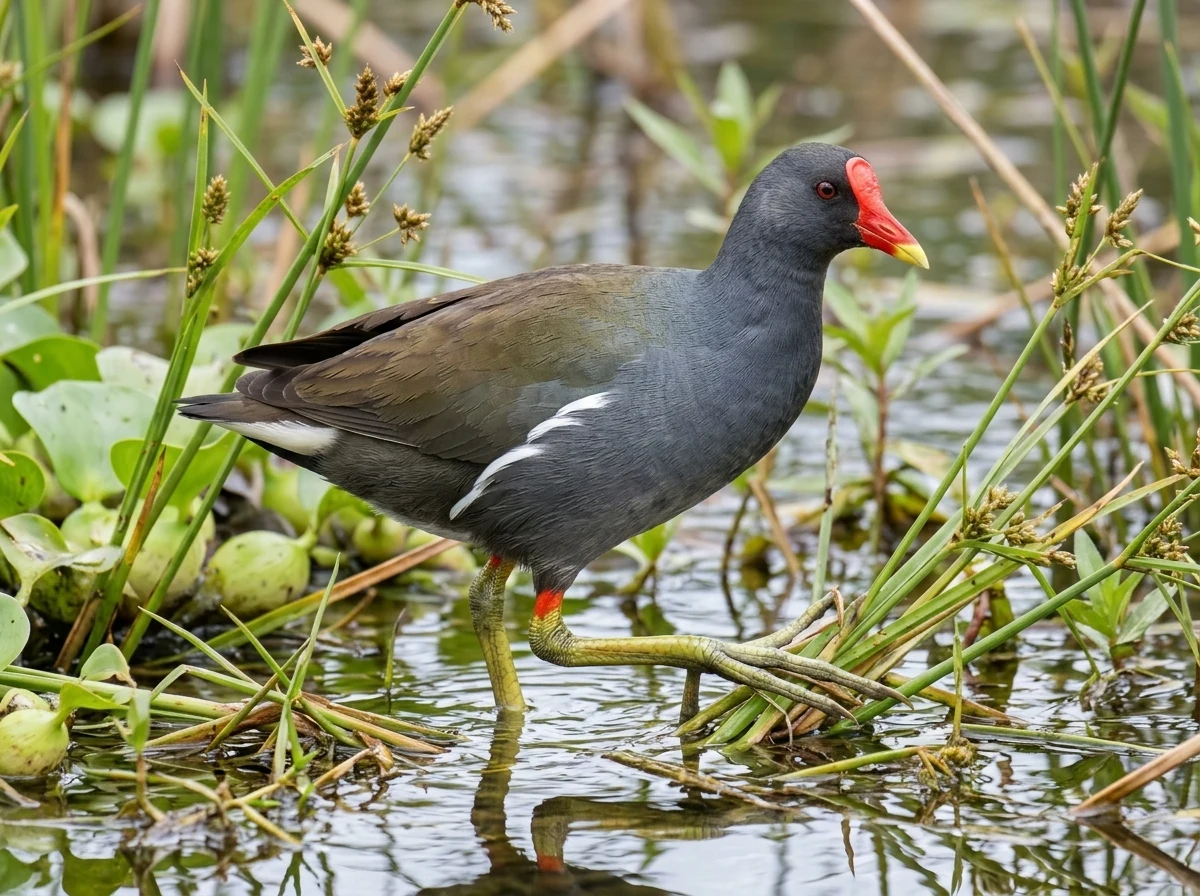
In wetlands, the Common Gallinule is a rail the size of a small duck, with a short red-and-yellow bill in the adult, and a variety of loud and unusual calls (s6). The Clapper Rail is a large brown rail that lives in coastal wetlands (catalog). As a practice suggestion, compare the duration and rhythm of their calls: rails often produce repeated series, and the difference may lie in speed and number of notes. This comparison is a proposed exercise, not a fact taken from the sources.
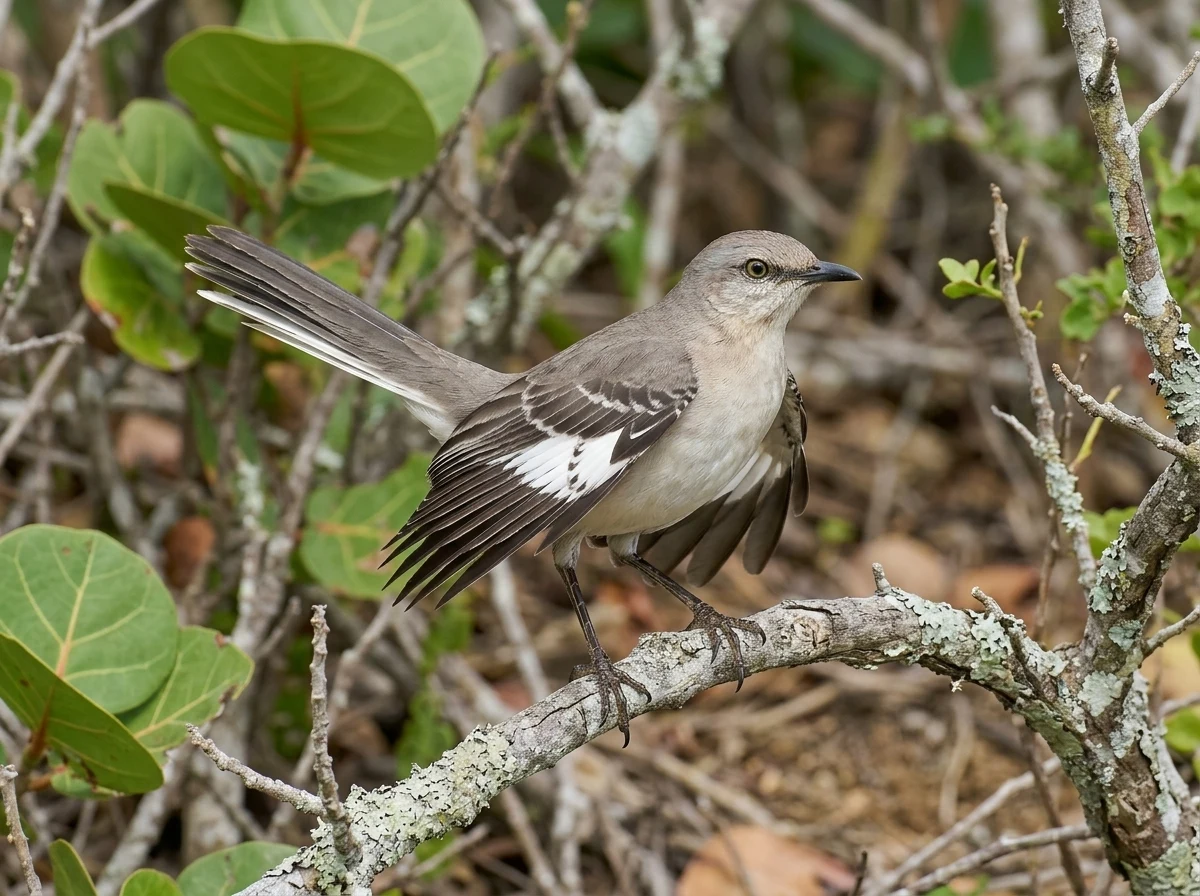
Among yard birds, the Northern Mockingbird is known for mimicking bird calls and other sounds, including artificial and electronic noises (catalog). As a practice suggestion, when comparing, don't look for a single fixed phrase, but for the mixture. The Gray Kingbird is a tyrant flycatcher listed in the catalog as associated with forests and coasts (catalog). Practice with these species and note which character — rhythm, timbre, duration — was most useful.
05
Step-by-step A/B exercise
Choose two recordings of species you confuse. Open them in two tabs and place their spectrograms side by side. Before listening, look at the two images and note three visual differences: for example, one is longer, one has more stacked lines, one ends rising. Then listen to recording A at normal speed, then B, and alternate twice. Finally, play both at reduced speed and count elements and pauses.
When you finish, write a one-line sentence summarizing the difference, such as "A rises at the end; B stays flat." That sentence is your field hypothesis. On your next outing, listen first without looking and try to assign each sound to A or B. If you fail, return to the exercise. Repeated comparison is what trains the ear.
Linked profiles
Birds mentioned
Puerto Rico species useful for practicing A/B comparison.


01
What is the best way to compare two bird sounds?
Place two spectrograms side by side, listen to each recording at normal speed and then at reduced speed, and note concrete differences in shape, rhythm, and duration. Spectrograms allow comparison by sight, which can be more efficient and precise than by sound alone (s1).
02
Which apps allow generating spectrograms in the field?
On Android, SpectralPro Analyzer; on iPhone, SpectrumView. A sample rate of 22,000 Hz and a black-on-white color scheme are recommended for graphing bird sounds (s2). The main drawback is that the bird must be loud and close for a clean visualization (s2).
03
How does slowing down playback help?
Slowing down separates what the ear groups together. A tiny break in the middle of a note can make it sound slightly double-syllabled, and once you see the break on the spectrogram you start hearing it (s2). Slowed playback turns an ornament into a sequence of elements you can count.
04
Which Puerto Rico species can I use for practice?
The Puerto Rican Owl, with its short, deep trill of 3–5 seconds (s5), the Common Gallinule and Clapper Rail in wetlands (s6, catalog), and the Northern Mockingbird and Gray Kingbird among yard and coastal birds (catalog). Compare duration, rhythm, and timbre.
05
Do I need professional equipment to compare sounds?
No. For practice at home, archived recordings and a screen are enough. In the field, a phone with a spectrogram app is sufficient; an external microphone improves quality if the bird is far away (s2).
Keep exploring
Connected routes
Sources and review
The evidence is one link away.
These sources support the editorial scope of this guide. Bird profiles also retain their own taxonomy, occurrence, and conservation references.
Reviewed:
01↗02↗03↗04↗05↗
ebird.org
macaulay library unveils new look for spectrograms
Evidence for cited sections; consult the original document.www.audubon.org
start using spectrograms read bird songs and calls
Evidence for cited sections; consult the original document.www.audubon.org
10 common bird songs made less confusing
Evidence for cited sections; consult the original document.birdsoftheworld.org
sounds
Evidence for cited sections; consult the original document.birdsoftheworld.org
sounds
Evidence for cited sections; consult the original document.The atlas continues