 AI
AILearning guide
Map Migratory Routes with eBird Data
Learn to use open eBird data to visualize the migration of birds passing through Puerto Rico. A hands-on data science activity for the classroom.
Reviewed:Prepared with AI assistance and linked sources. Illustrations are not field photographs.
Why map migration with eBird?
Every year, millions of migratory birds cross the Caribbean and many pass through Puerto Rico. Species such as the Blackpoll Warbler, American Redstart, Northern Waterthrush, Barn Swallow, and Peregrine Falcon appear on the island during their journeys. But how do we know when they arrive and which routes they take? One powerful way to answer this is with citizen science data.
eBird, a project of the Cornell Lab of Ornithology, collects bird observations from around the world. These data are openly available and can be downloaded, filtered, and visualized on maps. In this guide you will learn to download eBird data, filter by species, and plot migratory routes. It is an ideal activity for high school students that combines biology, geography, and data analysis.
Learning guide
Key facts
5migratory species to practice withBlackpoll Warbler, American Redstart, Northern Waterthrush, Barn Swallow, and Peregrine Falcon.
2eBird data sourcesThe eBird Basic Dataset (EBD) and the eBird Observational Dataset (EOD).
7typical days to wait for EBD approvalEBD requests are typically approved within 7 days.
01
Step 1: Download eBird data
eBird offers several open data products. The most comprehensive is the eBird Basic Dataset (EBD), which contains all raw observations with associated metadata such as sampling effort, coordinates, and region codes. It is updated on the 15th of each month and is available to any logged-in user who completes a data request form. Requests are typically approved within 7 days. Data are delivered as a tab-delimited text file that can be opened in Excel or analyzed with programs like R.
If you need simpler data, the eBird Observational Dataset (EOD) is updated annually and available through the Global Biodiversity Information Facility. It contains basic occurrence data (species, date, and location) but does not include effort metadata. For school projects, the EOD may be sufficient and easier to handle. You can also download your own personal data from My eBird if you have recorded observations.
02
Step 2: Filter by species and region
Once you have downloaded the EBD, the file contains millions of rows. To work with migratory species that pass through Puerto Rico, you need to filter by species and region. The EBD includes a region code column; for Puerto Rico, the code is 'PR'. It also includes the scientific and common name of each species. You can use Excel or R to filter rows where the region column is 'PR' and the species is one of those you are interested in.
For example, for the Blackpoll Warbler (Setophaga striata), filter by 'Setophaga striata' in the scientific name column. Repeat for the American Redstart (Setophaga ruticilla), Northern Waterthrush (Parkesia noveboracensis), Barn Swallow (Hirundo rustica), and Peregrine Falcon (Falco peregrinus). If you use R, the 'auk' package is specifically designed to extract and process EBD data. For the EOD, you can filter directly on the GBIF platform or download the data and filter it in a spreadsheet.
03
Step 3: Plot routes on a map
With the filtered data, each row represents an observation with latitude and longitude coordinates. To visualize migratory routes, you can plot points on a map and connect them in chronological order. Free tools like Google My Maps, QGIS, or the 'ggplot2' package in R allow you to create point maps. If you sort observations by date, you can draw lines connecting the points to suggest the migration route.
It is important to remember that eBird data are observations from amateurs and scientists, not satellite tracking. The points on the map show where a bird has been observed, not necessarily the exact route it followed. Still, by accumulating many observations, patterns emerge: for example, the Blackpoll Warbler is observed in Puerto Rico during fall migration, and the American Redstart and Northern Waterthrush also appear on the island during their journeys. The Barn Swallow and Peregrine Falcon, although with different routes, are also recorded in Puerto Rico.
04
Limitations of eBird data
eBird data are powerful but have limitations. They are not a systematic survey: coverage depends on where observers are. Remote or hard-to-access areas may have fewer observations. In addition, sensitive species are obscured in public outputs, and some observations may be provisional or unverified. The EBD includes the option to download provisional records, but these have not been accepted by volunteer reviewers.
For a school project, it is crucial to discuss these limitations with students. One should not conclude that a bird is absent just because there are no observations; it may be that no one has looked. Sampling effort must also be considered: a 10-minute checklist is not the same as a 3-hour one. The EBD includes effort data, allowing for more rigorous analyses. For simple visualizations, it is enough to recognize that maps show observation patterns, not the complete reality.
05
Classroom activity
This activity is designed for high school students and can be completed in two or three sessions. Objective: download eBird data for a migratory species, filter for Puerto Rico, and create a map of observations by date. Materials: computers with internet access, spreadsheet (Excel or Google Sheets), and optionally QGIS or Google My Maps. Procedure: 1) Register on eBird and request the EBD or download the EOD from GBIF. 2) Filter the data for Puerto Rico (code 'PR') and for an assigned species. 3) Sort observations by date. 4) Create a point map with the coordinates. 5) Draw lines connecting the points in chronological order. 6) Discuss the observed patterns and limitations.
For assessment, ask students to submit a map with at least 10 observations, a brief description of the suggested route, and a paragraph on data limitations. They can also compare two species: for example, the Blackpoll Warbler and the Barn Swallow. What differences do they see in the distribution of observations? Are there months with more records? This comparison encourages critical thinking and data interpretation.
Linked profiles
Species to practice with
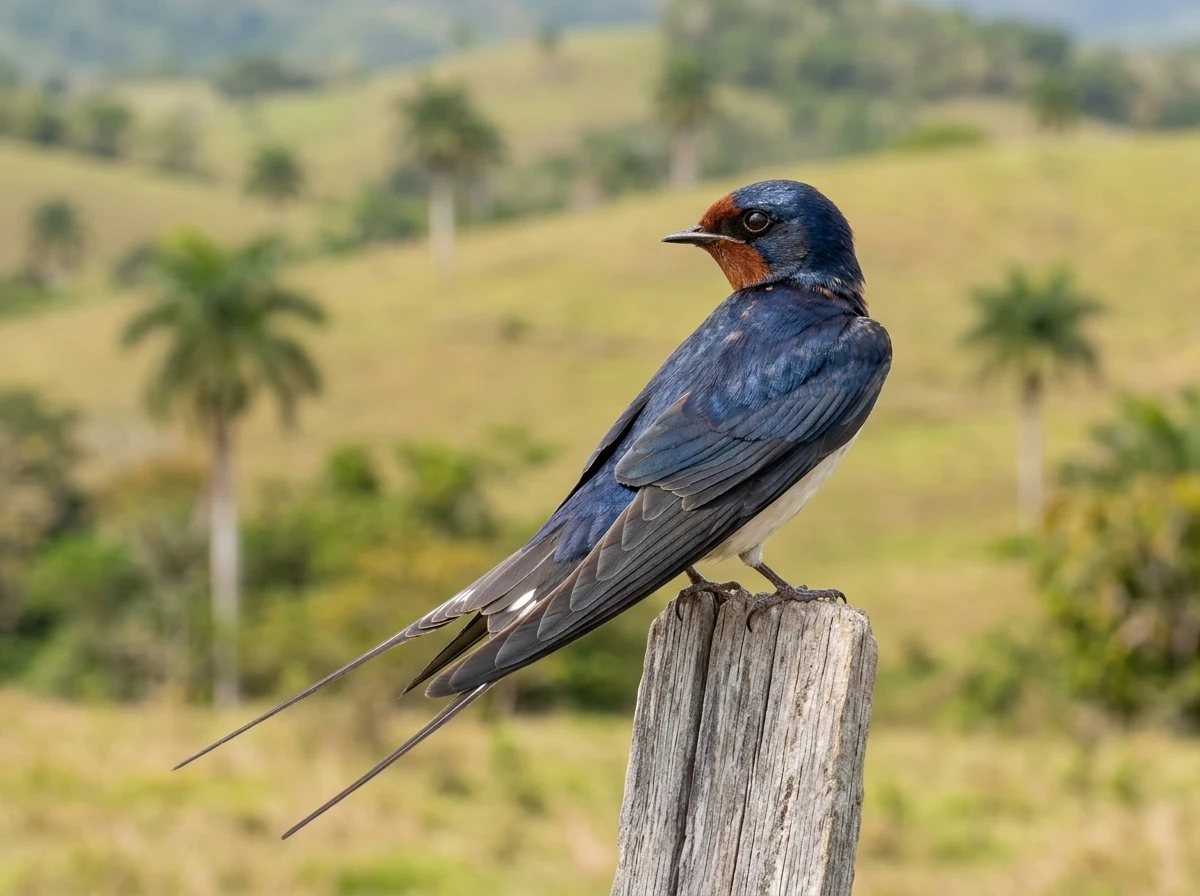
These five migratory species can be used to filter data and plot routes on the map.



01
Do I need an eBird account to download data?
Yes, to download the eBird Basic Dataset (EBD) you need an eBird account and to complete a request form. The eBird Observational Dataset (EOD) is available through GBIF and does not require an eBird account, but may require registration on GBIF.
02
How long does EBD approval take?
EBD requests are typically approved within 7 days, according to eBird documentation.
03
Can I use Excel to analyze the data?
Excel works for basic analyses, but for large datasets (over 1 million rows) or more sophisticated analyses, eBird recommends using programs like R. The 'auk' package is designed to work with the EBD.
04
Do eBird maps show the exact migration route?
No. eBird data are observations of birds at specific places and dates. Maps show observation patterns, not the exact route a bird follows. Exact routes require satellite tracking, which is not included in eBird.
05
Which migratory species can I use for the activity?
You can use the Blackpoll Warbler, American Redstart, Northern Waterthrush, Barn Swallow, and Peregrine Falcon. All are documented as present in Puerto Rico during migration or as migrants.
Keep exploring
Connected routes
Sources and review
The evidence is one link away.
These sources support the editorial scope of this guide. Bird profiles also retain their own taxonomy, occurrence, and conservation references.
Reviewed:
The atlas continues